Editorial Feature
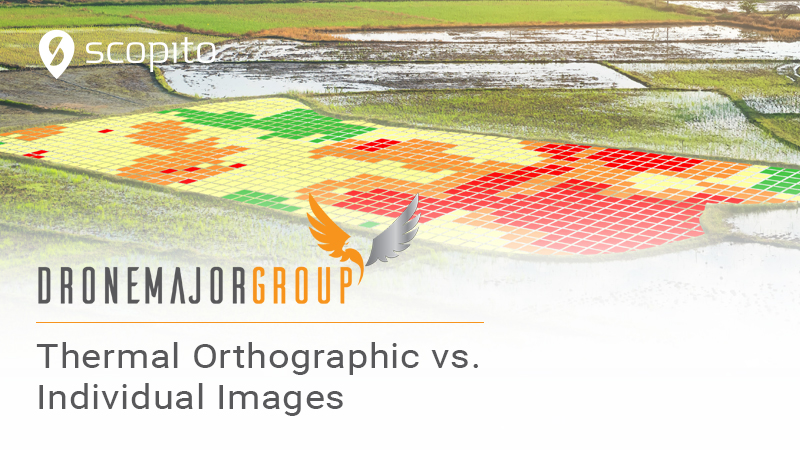
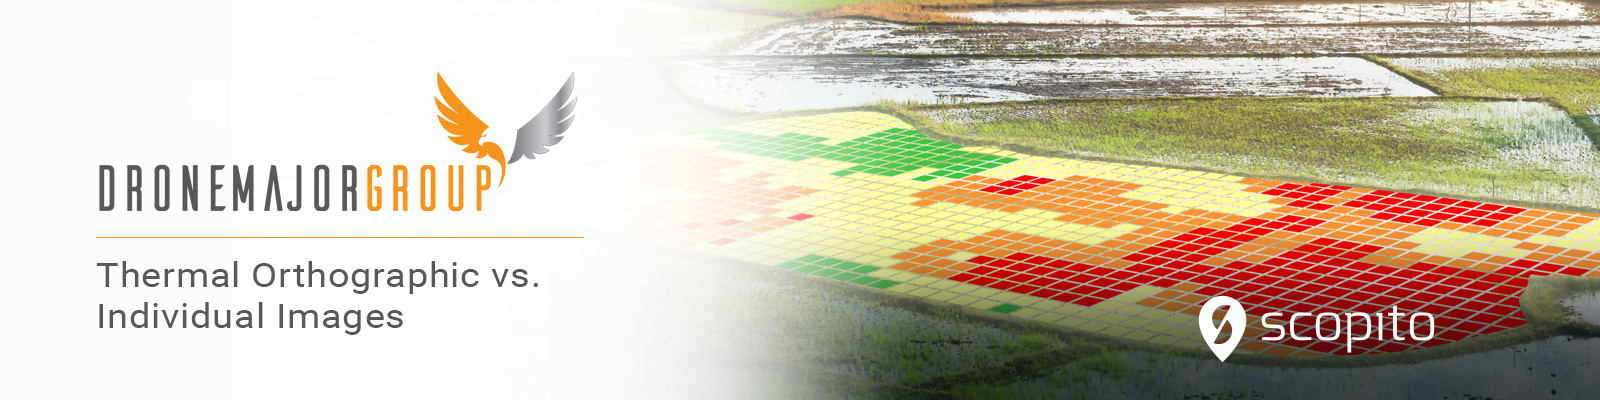
Thermal orthographic vs individual images
Words By: Scopito ©
We thought it would be interesting to compare thermal orthographic (stitched images) versus individual images, to examine flight times of data collection and resulting deliverables.
Thermal orthographic vs. individual images
When conducting a thermal survey of solar pv by UAV/drone, the data can be collected in a variety of formats (video/stitched images/individual image). It can also be processed in different ways, all of which have pros and cons.
We thought it would be interesting to compare thermal orthographic (stitched images) and individual images, examining flight times of data collection and comparing resulting deliverables.
The testing ground
We start in a small field of approx. 1.5MW, which has a selection of anomalies.
The following results are an illustration of the types of differences, that can be observed between methods and heights.
Not all solar farms are the same, and so results can vary.
Thermal Orthographic (6GSD)
By collecting many overlapping images, and processing them in some very clever software, thermal images can be stitched together to create a thermal orthographic or ‘map’ of the solar farm.
This flight was programmed to collect images with a 62% sidelap and a 75% frontlap.
The imagery is at 6cm GSD. 389 images were captured in 16m and 11s.
The modules need to be inspected during sunny conditions. This means a constant battle to avoid the suns glare, reflecting from the modules. Glare can disrupt the software from matching and stitching images.
The video above shows the flight route and the resulting ‘map’.
There’s no denying; it looks really good. m
Most of the anomalies can be seen, and it is easy to overlay a layout diagram to report the location. However, when we take a closer look, the data is very low resolution, and therefore difficult to analyse fully.
The RGB data that is needed, to confirm if a hotspot is worthy of a visit by an engineer (or just the side effect of bird soiling for example), would also need to be collected. Often with another flight.
It should be processed and analysed in tandem with the thermal map.
This ortho was processed using the Rjpegs and is not radiometric.
To be able to analyse temperature deltas in the ortho, the data would have to be processed using radiometric TIFF files and suitable software.
Individual images
3 rows (6cm GSD)
By spending a little bit more effort on the flight planning, we can program our UAV to take precisely positioned individual images.
The flight route needs to be more precise, but the payoff is huge when you compare the amount of MW you can survey per flight.
The image below shows my flight plan for the thermal ortho, compared to that for the ‘3 row’ flight.
As there is no need to try and stitch the images, no overlap was required (sidelap) and the focus is on keeping the rows squarely framed in each shot. Each image overlaps slightly (frontlap) at around 20%, just to ensure that no modules are missed. This can be increased to 50% if necessary, to negate glare.
This flight took just 5min 44s and created 45 images.
As the flight was at the same height and therefore the same 6cm GSD, the results were very similar.
The RGB data was recorded in the same flight, which is adequate at best.
2 rows (4 GSD)
With the time saving we achieved, we repeated the inspection flight, but change the parameters to survey 2 rows of modules per sweep.
This flight only took 7min 57s and recorded 76 images.
A good workflow is needed to report the position of the modules.
The improved GSD of over 30% gives much better resolution and clarity on both the thermal and RGB data.
Each jpeg is radiometric, and can simply be worked on for in-depth thermal analysis.
1 row (2 GSD)
Encouraged by the time savings and improved results of the 2-row survey, we ran another mission for 1 row.
This flight took over 24minutes, and did not cover the whole sample site.
It is double flight-length compared to the 2-row route. Another consideration is, that this level of flight must be performed at slower airspeed, to avoid motion blur in the data.
The data looks great, but localising the fault is challenging.
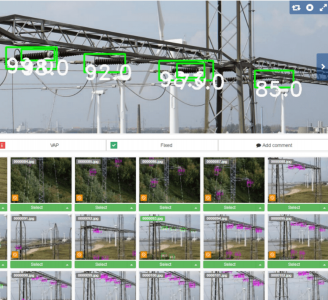
Analysis performed in Scopito
This type of close inspection flight is ideally used to inspect of an area of modules, which are known to have subtle latent defects such as snail trails or PID.
Conclusion
Thermal orthographics look nice and are easy to fly. But, the amount of data and flying required, is substantial.
There are obvious restrictions to the achievable quality and post processing.
Not only does it become financially unfeasible to collect and process high resolution data, but stitching softwares tend struggle to process images that have been flown from a low altitude, particularly without ground control points.
In my opinion, this workflow is suitable where more obvious faults need to be analysed, and flights are conducted at a high level.
For clients who require more detailed results, significant improvements to the data quality can be gained by flying lower and using an individual image inspection workflow. Additionally, substantial time savings can be made in the field, and on post processing.
When compared to the orthographic method, the 2-row route:
· Reduced flight times by over 50%
· Improved the data quality by over 30%
· Was processed considerably quicker
· Required 80% less data
For more information please get in touch.